Core Concepts
EventScout is a powerful event tracking and analytics platform that allows you to track events on your sites, applications and services. To get the most out of EventScout, it is important to understand the core concepts that underpin the platform.
Workspaces
A workspace is a container for all of the different applications and services that you utilize with EventScout. You can think of a workspace as a project or a collection of applications and services that are all related. Workspaces are also a way to manage access control and permissions for different users within your organisation. You can create multiple workspaces within a single account to manage different projects or teams.
Sources
A Source represents an application or service that is sending events to EventScout. For example, you might create a Source for your "Website". You might also create separate sources for your "Web app", and/or your "Mobile app". It's up to you how you want to structure your Sources.
Each Source has a unique source ID that is used to identify it when sending events. You can find the source ID in the settings for each Source.
Events
Events are the actions or changes that occur on your sites, applications and services. This can include both user-generated and non user-generated events. For example, you might track events like "page_view", "button_click", "form_submit", "purchase", etc. You might also trigger events during the application lifecycle in order to gain observability into what's happening inside the app. Events are sent to EventScout using the EventScout SDKs or API. Once an event is received by EventScout, it is stored in the database and can be queried and analysed using the EventScout dashboard.
Events are the core of EventScout and enable many different use cases. For example, you can use events to track user behaviour, monitor the performance of your applications, and create custom reports and dashboards.
Dashboards
Dashboards are a way to visualize and analyse the events that are being sent to EventScout. You can create custom dashboards that display the events that are most important to you. For example, you might create a dashboard that shows the number of page views on your website, the number of signups on your web app, and the number of purchases on your mobile app.
Panels
Panels are the building blocks of dashboards. You can add panels to your dashboards to display different types of data. For example, you might add a line chart panel to display the number of page views over time, or a scoreboard panel to display the distribution of events by source.
The following are some of the different types of panels that you can add to your dashboards:
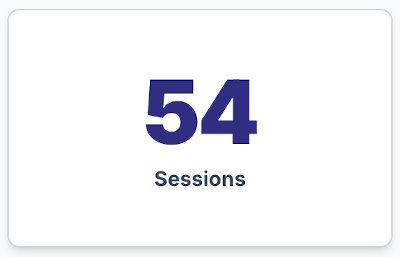
- Tally: A tally panel displays the total number count from the configured filters. You can customise the tally panel to display different metrics and dimensions.
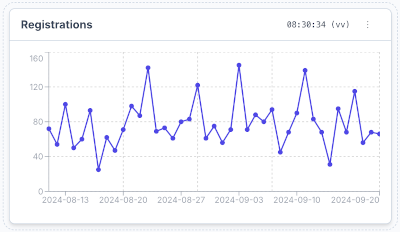
- Line chart: A line chart panel displays a series of data points in a standard line chart, based on the configured filters.
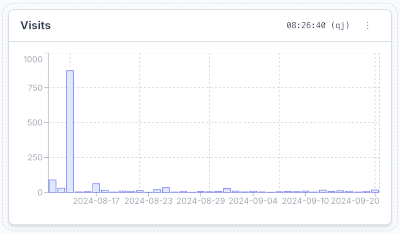
- Bar chart: A bar chart panel displays a series of data points in a standard bar chart. You can customise the bar chart to display different metrics and dimensions.
- Scoreboard: A scoreboard panel displays the distribution of events from the configured filters. You can customise the scoreboard to display different metrics and dimensions.
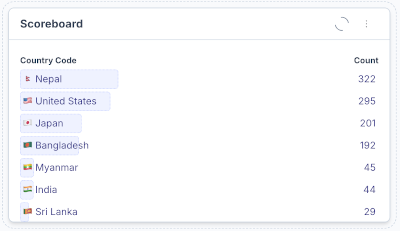
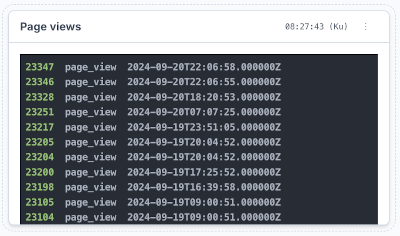
- Tail: A tail panel displays a list of events and their timestamp (Like the tail command in Unix). You can customise the tail panel to display different metrics and dimensions.
