Custom Events
EventScout allows you to track custom events on your sites, applications and services. You can track any event that is important to you. This might include things like user signups, purchases, logins, and more.
How to track custom events
To track a custom event, you need to send a POST request to the EventScout API with the event data. The API endpoint for tracking custom events is /api/events.
Here is an example of a POST request to track a custom event:
curl -X POST \
  https://api.eventscout.io/api/events \
  -H 'Content-Type: application/json' \
  -d '{
        "type": "user.signup",
        "source_id": "xgyz",
        "user_id": "123",
        "payload": {
            "email": "[email protected]",
            "name": "Bill Gates"
        }
    }'
Note: The source_id is the ID of the source that is sending the event. You can find the source ID after logging in to the dashboard. See Sources for more information.
In this example, we are tracking a user.signup event with the payload containing the user's email, and name.
Event types
EventScout does not enforce a specific event schema. You can define your own event types and payloads based on your requirements. Our only recommendation is to use a consistent naming convention for your event types to make it easier to query and analyse your data.
Here are some common examples of event types that you might want to track:
user.signup: When a user signs up for your serviceuser.login: When a user logs in to your serviceuser.logout: When a user logs out of your serviceuser.purchase: When a user makes a purchasepage.view: When a user views a page on your website (Not to be confused withpage_viewwhich is a default event type for web analytics)button.click: When a user clicks a button on your websiteform.submit: When a user submits a form on your websiteerror: When an error occurs in your applicationpayment.success: When a payment is successfully processed
Event properties
The payload of a custom event can contain any data that is relevant to the event. This can include simple scalar values like strings and numbers, as well as more complex data structures like objects and arrays. You can include any properties that are relevant to the event you are tracking.
Querying custom events
Once you have tracked custom events, you can query and analyse the data using the EventScout dashboard. You can create custom reports and dashboards to visualise the data and gain insights into user behaviour, application performance, and more.
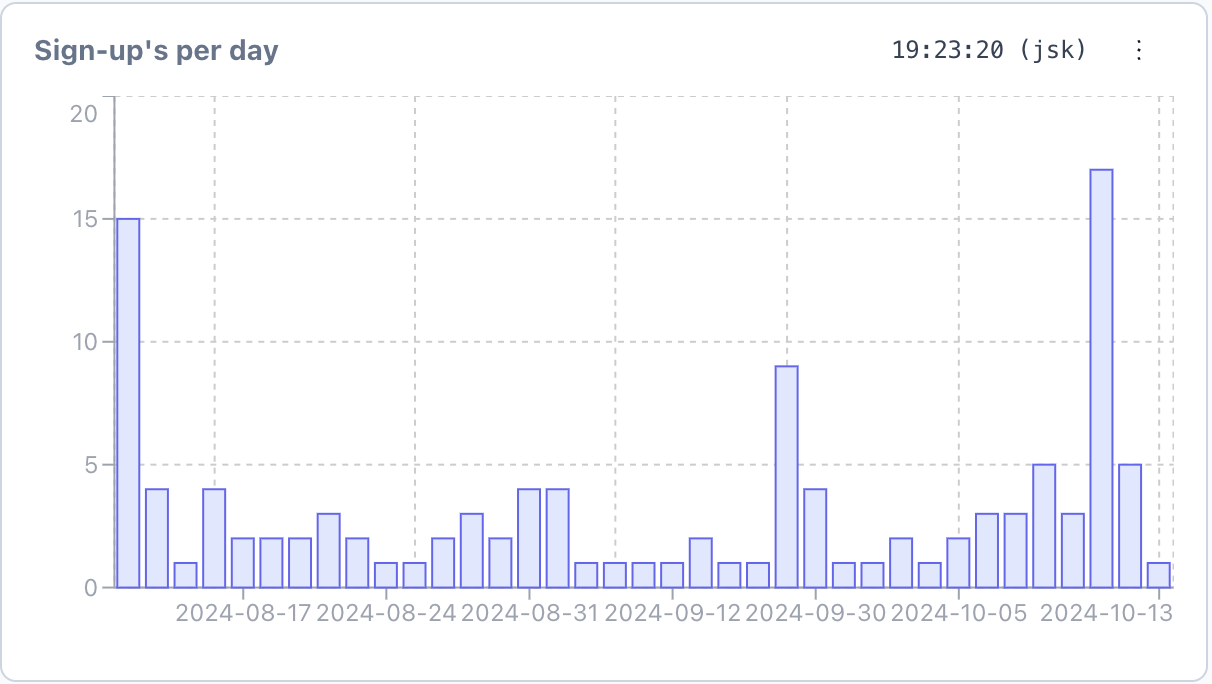
For example, you might want to create a dashboard that shows the number of user signups, logins, and purchases over time. You can create a custom dashboard with panels that display this data in a meaningful way.
Creating a custom dashboard
To create a custom dashboard, sign in to your EventScout dashboard and click on the "Create Dashboard" item in the navigation menu. Give your dashboard a name and you should see a blank canvas where you can add panels:

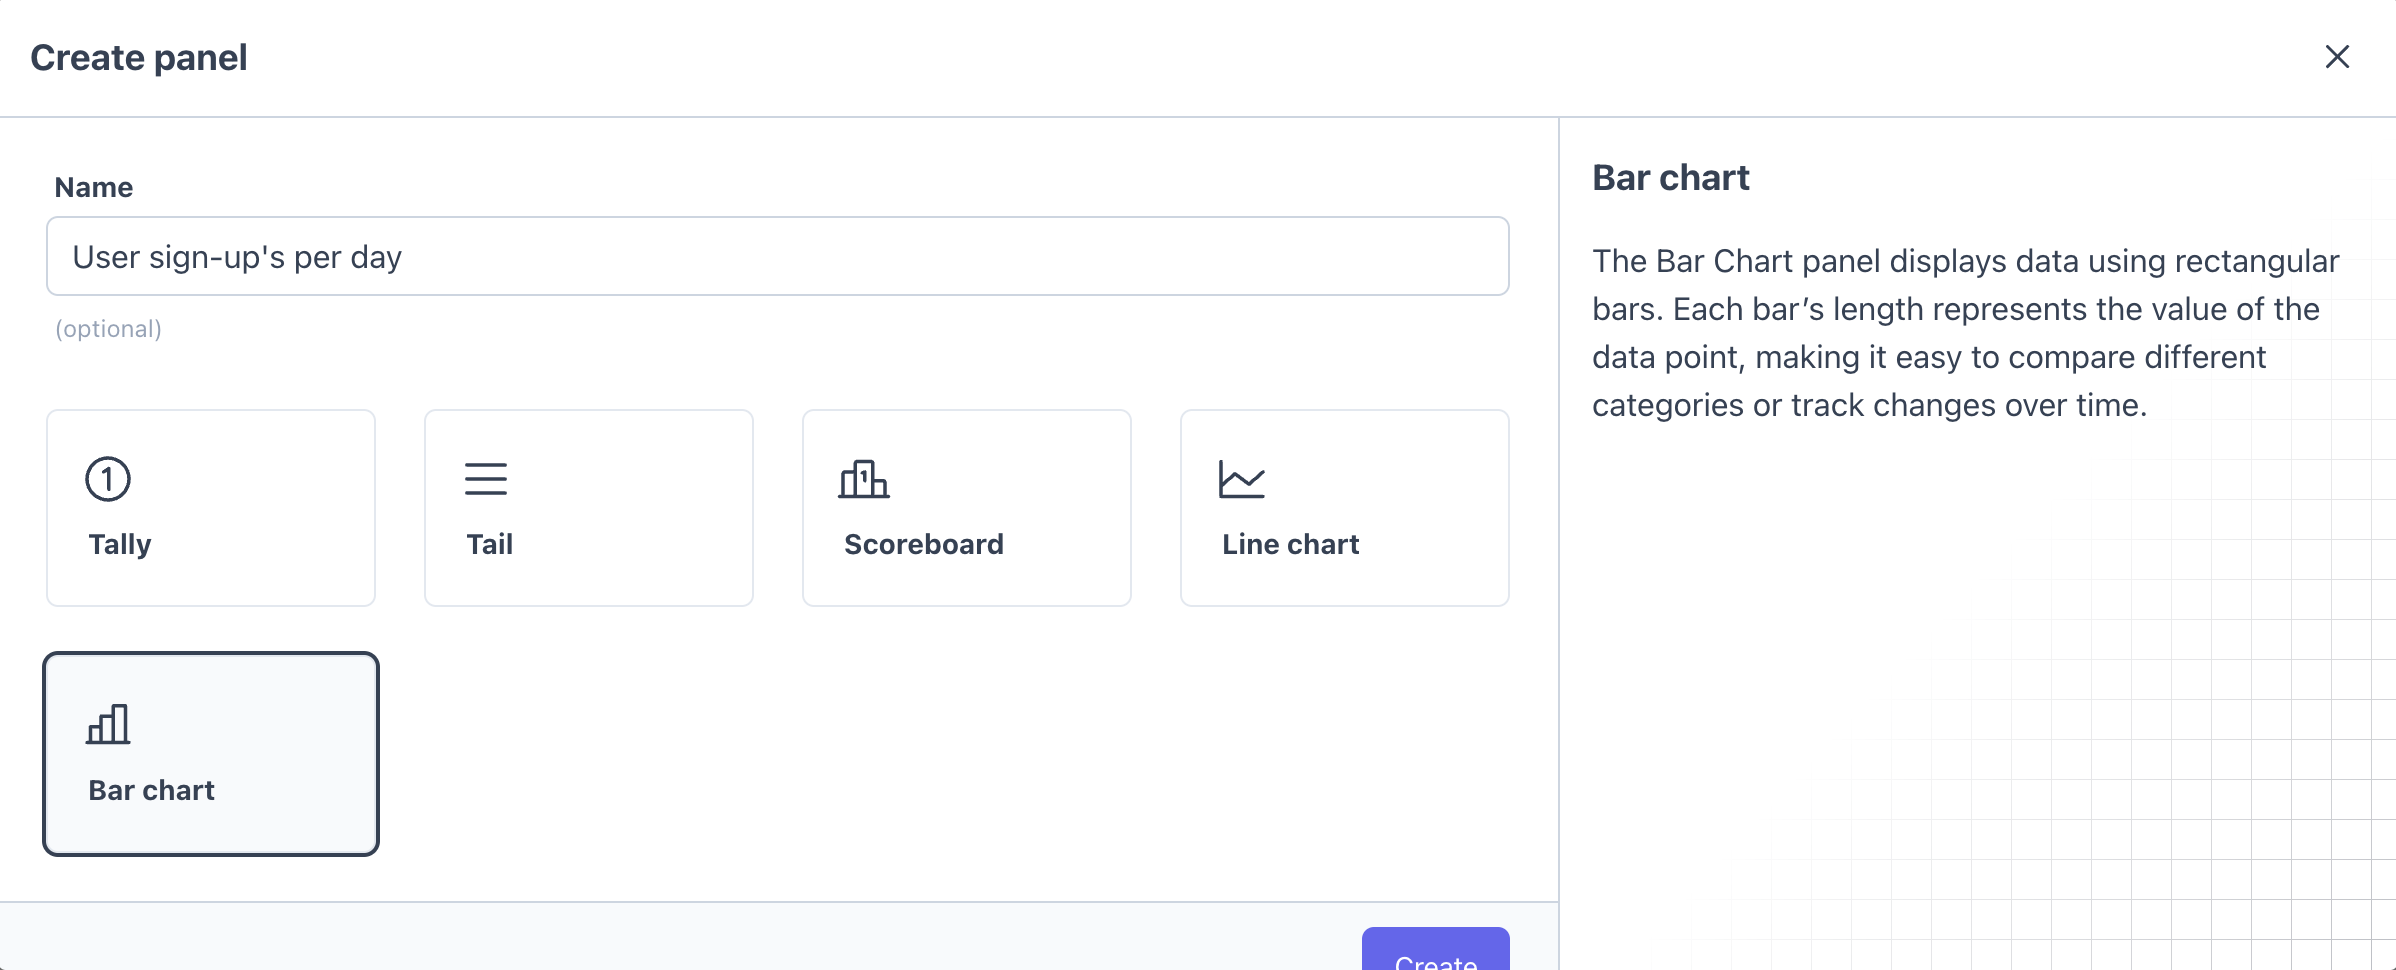
Next, click the 'Add Panel' button and select the type of panel you would like to create. You can choose from a variety of panel types, including line charts, bar charts, tables, and more. In this example we want to see 'Number of user signups over time', so we will select a bar chart panel:

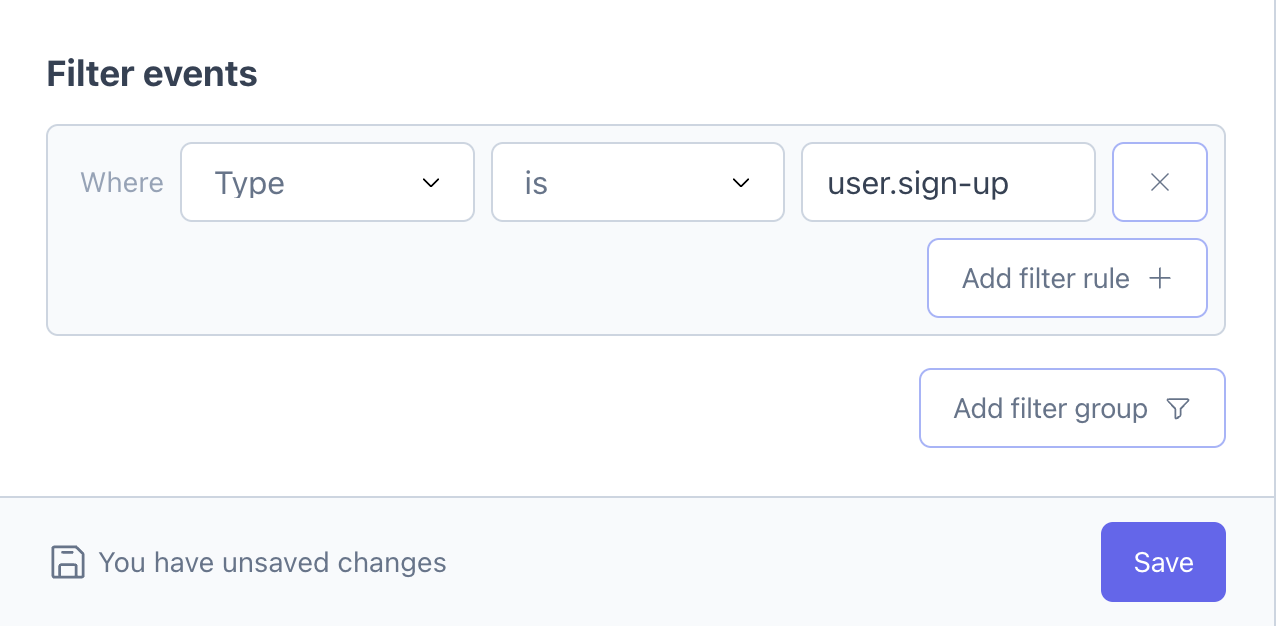
You can then configure the panel by selecting the event type, time range, and any filters you want to apply. Once you have configured the panel, click 'Save' and you should see the panel added to your dashboard:

Once configured you can view the data in real-time and see the number of user signups over time:
